China’s Economic Disparity…In Maps

Via Matt Hartzell’s blog, an interesting look at China’s economic distribution:

[click to enlarge]
How is income distributed across the Chinese nation? As we can see in the above map, highly unevenly! This map (which uses data accurate as of December 2011) uses blue to show those provinces where the average income is higher than the national average (14,581 RMB, or $2,314 in 2011 dollars), and orange to show those where it is lower. The division between high income coastal Chind and low income inland China is stark. But not all of coastal China is equal. Beijing and Shanghai have average incomes more than twice the national average, while Liaoning and Shandong are less than 10% higher. Turning inland, we can also see a highly uneven geography. The lowest incomes are in the deep west, while those closer to the coast are slightly higher.


[click to enlarge]
This map shows just disposable income of the urban population in each province (nationwide, about 51% of Chinese people are classified as urban). This time the results are a bit different. The coastal provinces still exceed the mean (which for urban residents is 21,810 RMB or $3,462) and the inland provinces still fall below it. But the shades of orange and blue are paler than in the above map, meaning the degree of disparity between coastal urbanites and inland urbanites is not quite as steep.
[click to enlarge]

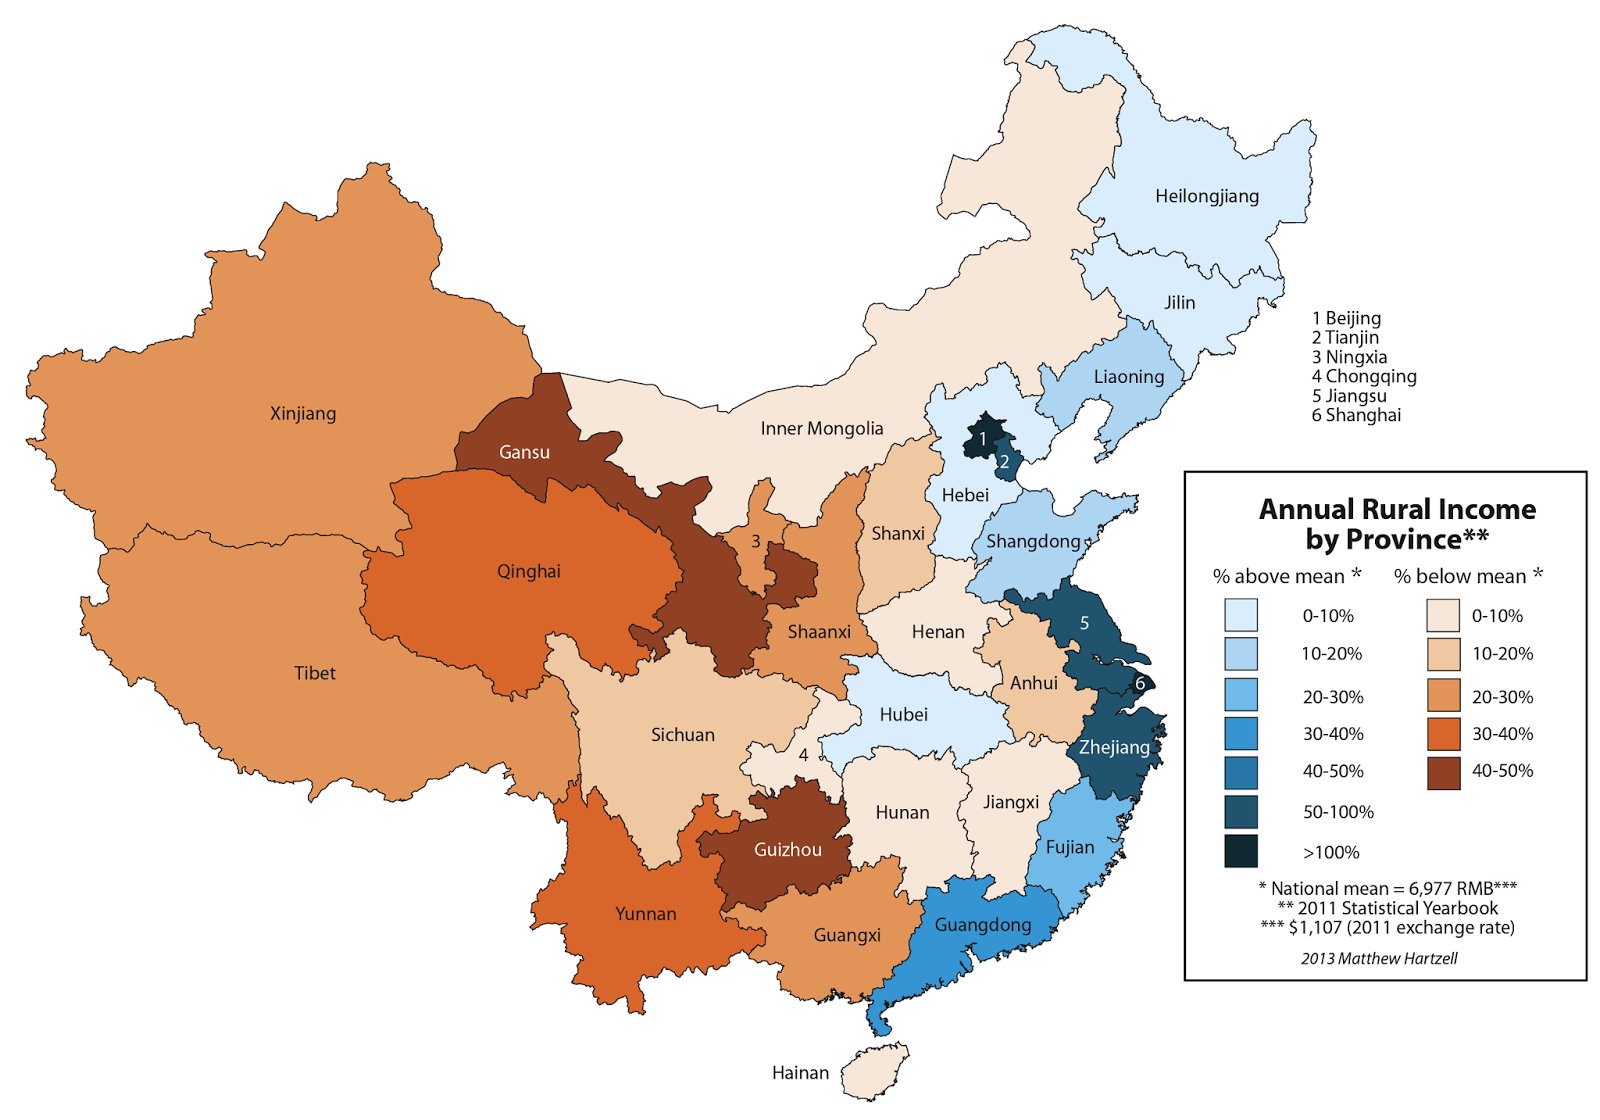
This map shows only rural incomes. Once again, coastal provinces have above-average incomes while (most) inland provinces are below-average. There are a few exceptions, though. Hubei, in the interior, manages to exceed the average, as do landlocked northeastern provinces Heilongjiang and Jilin. These provinces are considered the “breadbasket” of China, with the highest agricultural production, and their rural incomes reflect that. We can see a great amount of variety in the income levels of the rest of the inland provinces. This time, far western Tibet and Xinjiang are not the lowest; this perhaps is due to the sale of oil rights or the collection of caterpillar fungus to supplement rural incomes.

[click to enlarge]
What about the gap between rural and urban incomes? Since the above maps show rural and urban incomes in relation to their own means, comparing them is like apples and oranges. This map shows rural income as a percentage of urban income. This ratio ranges from 25% in Guizhou to 49% in Tianjin. This time the pattern on the map is a bit different. We see higher ratios or rural-to-urban income in general in coastal areas, but also in Xinjiang, Heilongjiang, and Jilin. In these provinces, rural populations are in a relatively stronger position vis-a-vis their urban counterparts. However, in two bands of provinces in the central north and southwest, rural incomes are far below urban incomes. One possible explanation for the relatively high income levels of rural populations in cities like Shanghai and Tianjin is the lump sum that developers pay farmers in compensation for developing their land.


[click to enlarge]

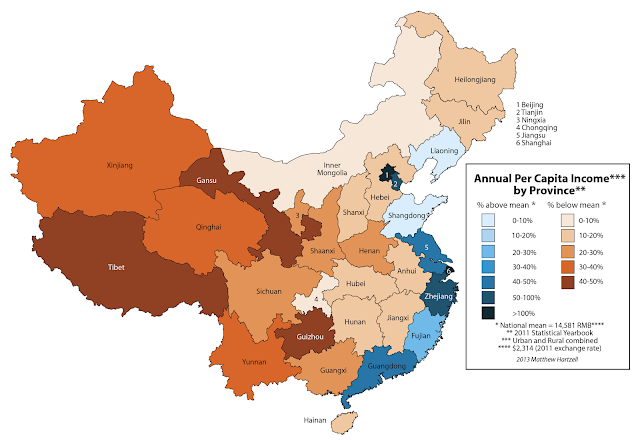
This image brings the three maps from the top of this post together for clearer comparative viewing. The map on the top—total income—is the sum of the two maps below—urban, and rural. If it doesn’t look that way, that’s because of variation in the population and urbanization rate between provinces.

[click to enlarge]

This final map has nothing to do with income. It reflects demographic information solely. The national urbanization rate (that is, the percentage of the population that lives in cities) is 51%. China’s population thus is nearly evenly split between urbanites and rural folk. But, as with income and so many other things, that split is distributed unevenly. In this map, those provinces colored blue exceed the national average for urbanization. Most coastal provinces fall in this category, with some exceptions: Shandong is more rural, while inland Chongqing, Hubei, Inner Mongolia, Heilongjiang, and Jilin are more urban. Tibet is, by far, the least urbanized province, with Guizhou in second place.


This entry was posted on Wednesday, September 11th, 2013 at 7:51 pm and is filed under China.  You can follow any responses to this entry through the RSS 2.0 feed.  Both comments and pings are currently closed. 

Comments are closed.


ABOUT
WILDCATS AND BLACK SHEEP
Wildcats & Black Sheep is a personal interest blog dedicated to the identification and evaluation of maverick investment opportunities arising in frontier - and, what some may consider to be, “rogue” or “black sheep” - markets around the world.

Focusing primarily on The New Seven Sisters - the largely state owned petroleum companies from the emerging world that have become key players in the oil & gas industry as identified by Carola Hoyos, Chief Energy Correspondent for The Financial Times - but spanning other nascent opportunities around the globe that may hold potential in the years ahead, Wildcats & Black Sheep is a place for the adventurous to contemplate & evaluate the emerging markets of tomorrow.